Charts UI kit as Figma templates library
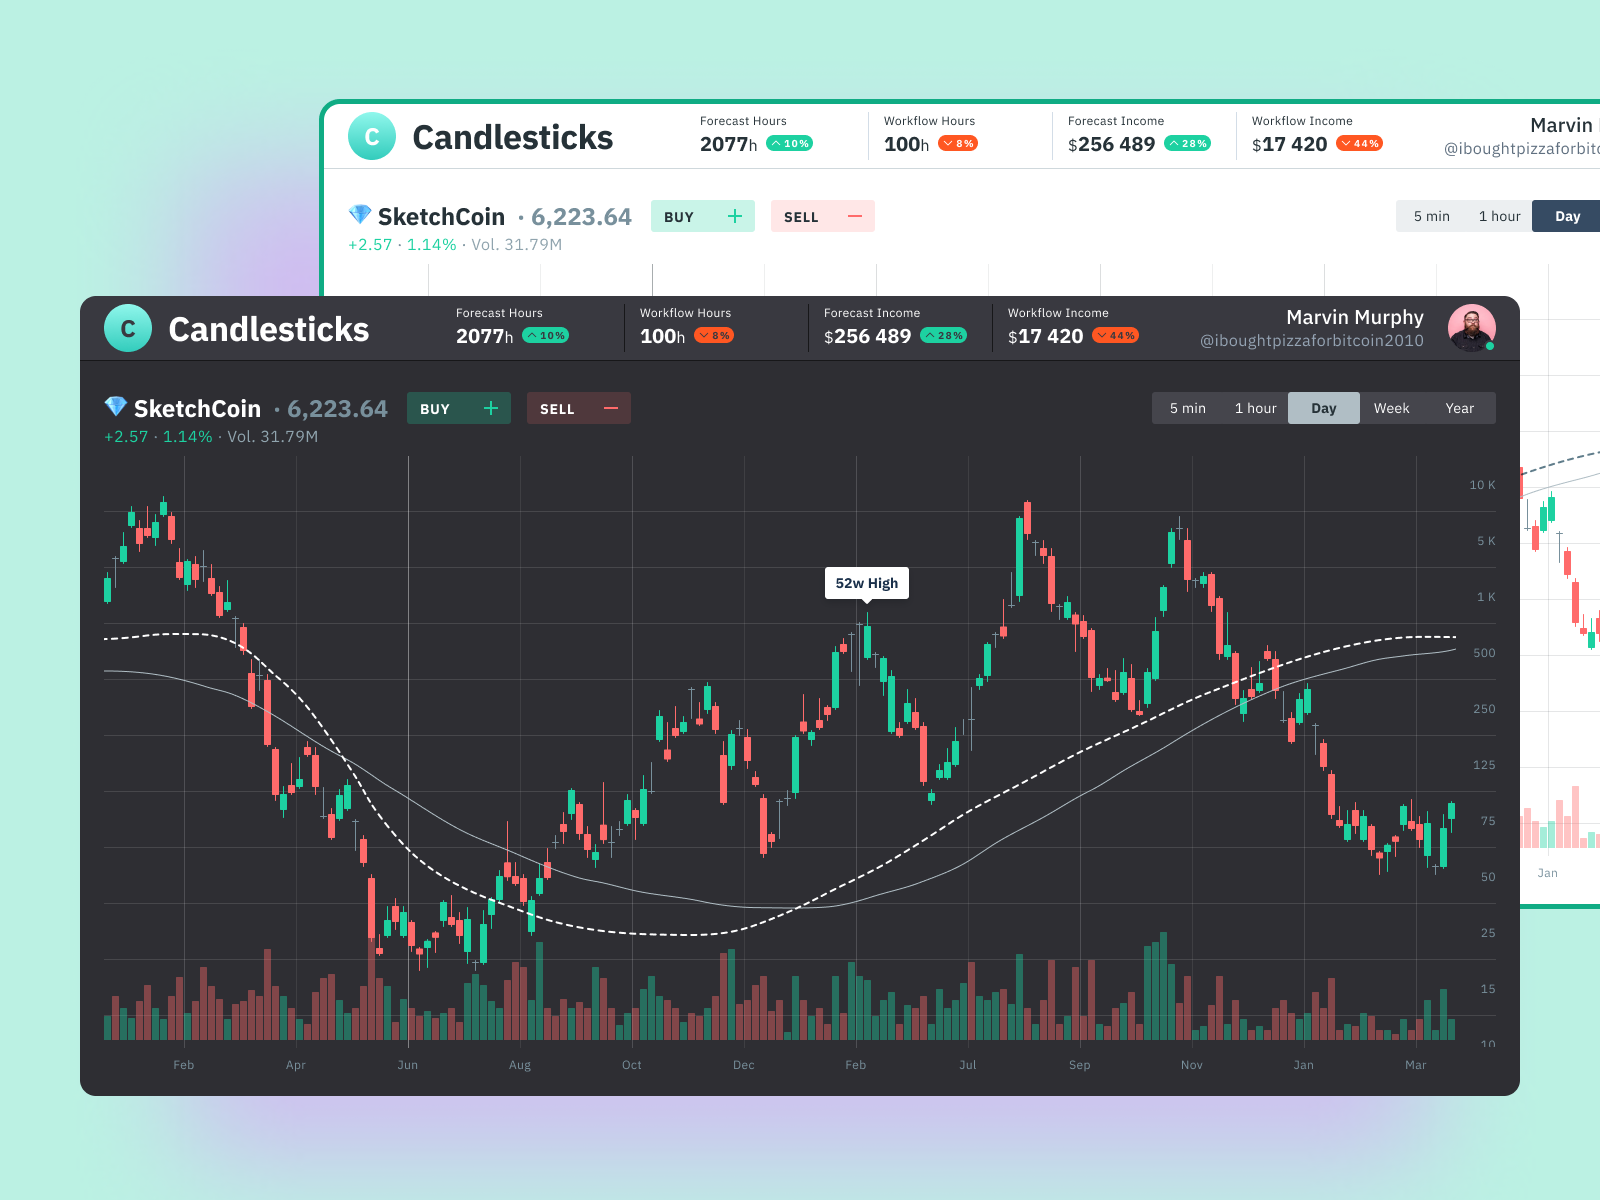
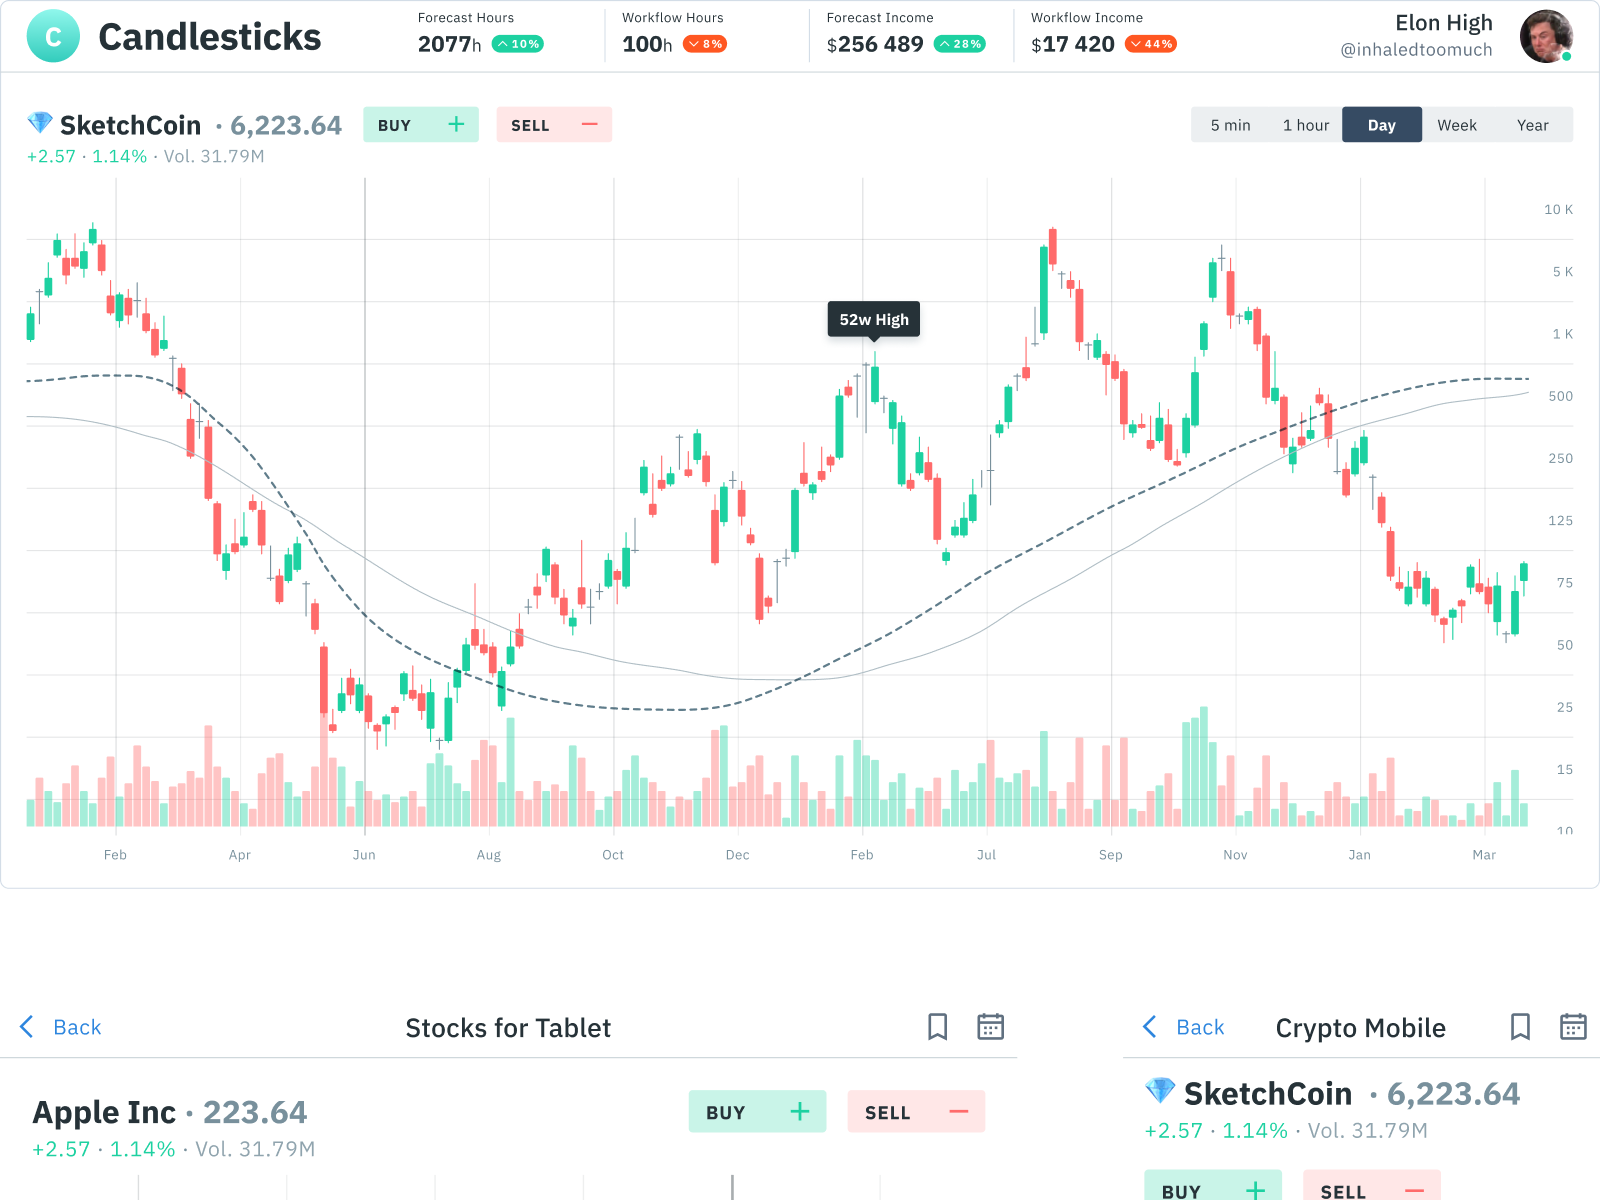
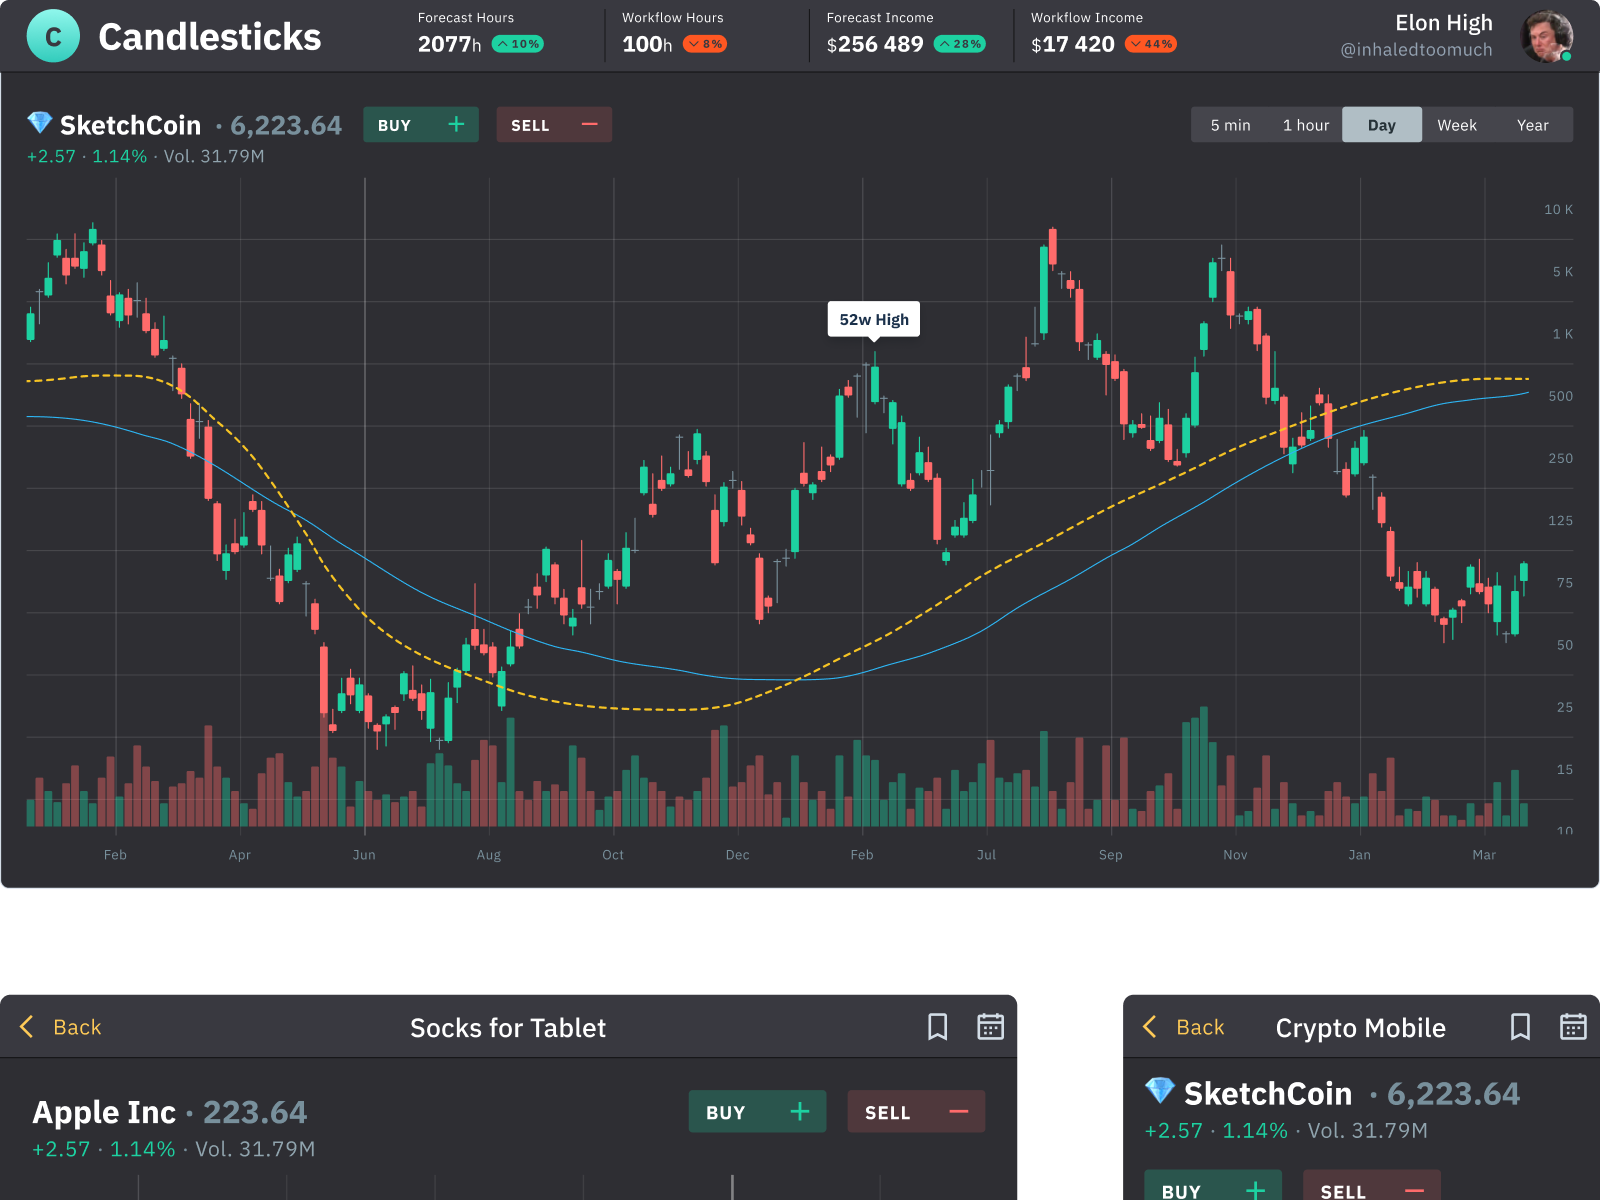
Candlesticks chart mostly used in a trading sphere to visualize and analyze the price movements
Figma charts library made of components. Contains most common data visualization patterns from simple bar charts to complicated heatmaps and financial candlesticks. Fits for dashboards, presentations, visualizations or any other type of data-design projects.
>>访问dribbble查看高清大图
做人要厚道,转载请注明文章来源:
https://www.boxui.com/ued/ui-design-ued/40473.html


评论回复